How to Reduce Food Waste with Predictive AI for Your Restaurant
For every $100 your restaurant spends on food, $4 to $10 ends up in the trash. That's not a guess — it's the industry average. For a mid-size restaurant doing $15K a week in food sales, that's $25,000 to $75,000 a year walking out the back door in spoiled produce, over-portioned plates, and prep that nobody ordered. The kicker? Most of that waste is preventable. You just need to know where it's coming from.
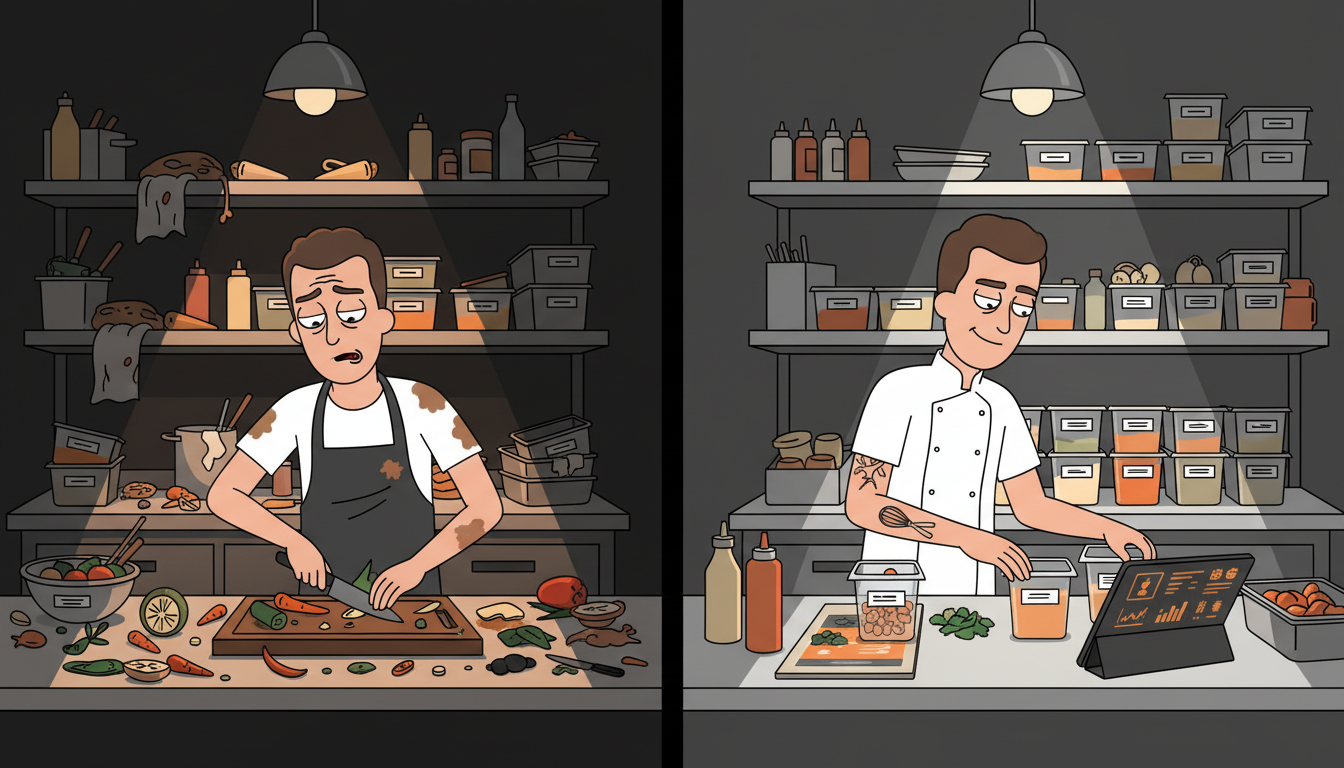
I've talked to operators who swear they don't waste food. Then they do a two-week waste audit and find $800 a week in the trash — mostly over-prep and spoilage from ordering based on "what we always order" instead of what the data says they'll sell. The gap between perception and reality is where the money lives. Here's how to close it.
Step 1: Audit Your Current Waste — What Gets Thrown Away and Why?
Before you buy any tool or install any software, do a two-week waste audit. No tech needed — just a clipboard, a scale, and honesty.
Put a clipboard and a scale by the back door or wherever waste gets tossed. Every time something gets thrown away, the person doing it writes down three things: what it was, how much, and why. The "why" is the most important part. Categorize it into four buckets:
- Spoilage: Ingredients that went bad before they were used. Over-ordered, stored wrong, or sat too long.
- Over-prep: Food that was prepped but never sold. The kitchen made 20 portions of soup, sold 12, tossed 8.
- Plate waste: Food that came back from the dining room. The guest didn't finish it. This is a portioning or menu issue.
- Kitchen errors: Dishes that were made wrong, dropped, burned, or sent back.
The audit itself costs nothing. It takes five minutes a day to log. And it will show you exactly where to focus your efforts — and your budget — for the biggest impact.
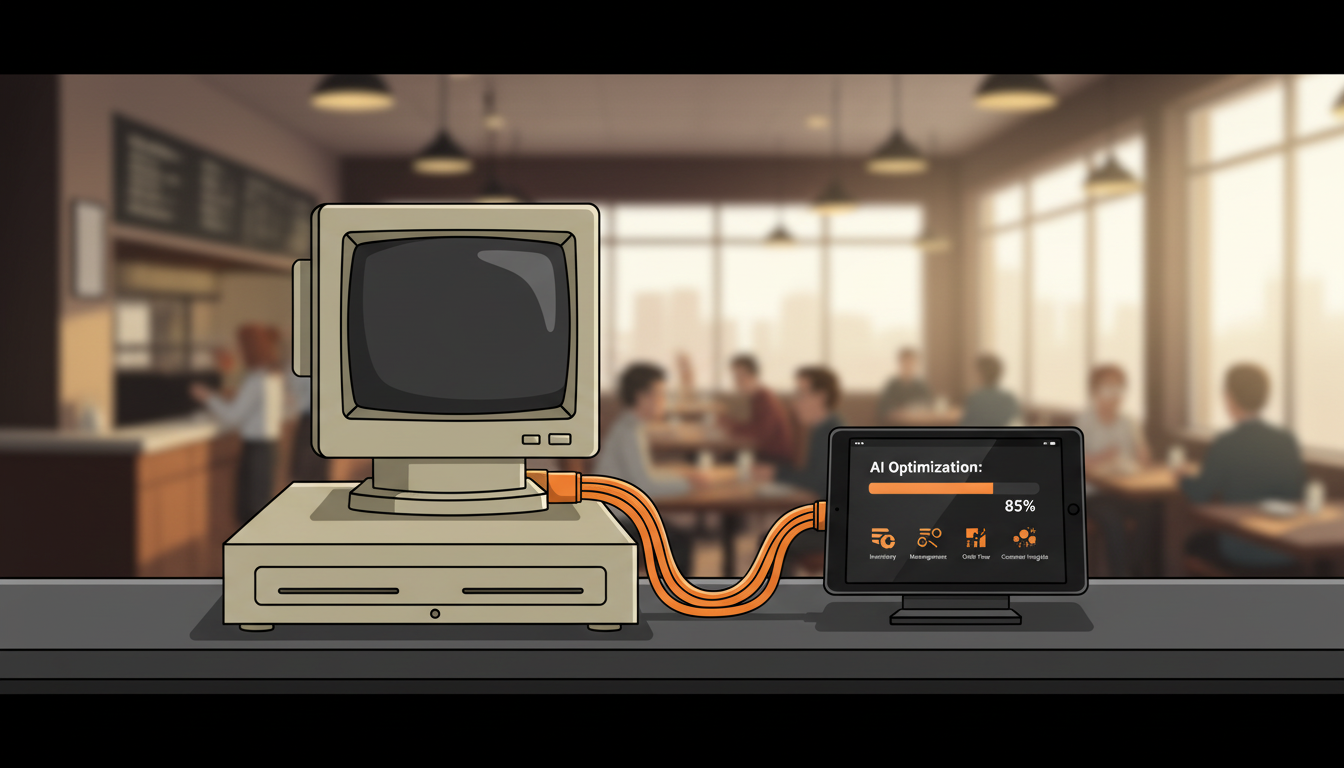
Step 2: Connect Your POS Sales Data — Your Demand Signal
Your POS already knows what you sold, when you sold it, and in what quantities. That's your demand signal — and it's the foundation of any predictive system.
Pull a 90-day export from your POS. You want sales data by item, broken down by day of week and time of day. Most modern POS systems (Square, Toast, Clover, Lightspeed) can do this with a few clicks. If your system can't export this data, that's a red flag worth addressing before anything else.
What you're looking for is patterns. Do you sell more burgers on Fridays? More salads on Mondays? Does the 6 PM to 8 PM window account for 60% of your dinner sales? These patterns are already in your data — you just need to see them.
Even a basic spreadsheet analysis reveals actionable insights. Sort your sales by day of week. Calculate the average covers per day. Look at the standard deviation — how much does Monday's sales vary from week to week? If Monday sales range from 80 to 150 covers, your prep list needs to account for that range. If they range from 90 to 110, you can prep with much more confidence.
This data is your demand signal. Everything else — weather, events, holidays — is a modifier on top of this baseline. Get the baseline right first.
Step 3: Build a Prep-to-Sales Forecast — Match Prep to Predicted Covers
Monday's prep list should reflect Monday's predicted sales, not "what we always make." This is the single biggest change you can make to reduce waste, and it doesn't require any AI — just data and discipline.
Take your 90-day sales data. For each day of the week, calculate the average number of each item sold. Then add a small buffer — 10 to 15% is enough for most items. That's your prep target.
Here's what this looks like in practice. Your data shows you sell an average of 34 burgers on Fridays, with a range of 28 to 42. Your old prep list called for 50 burgers every Friday "just in case." The new prep target is 34 plus 15% — about 39. That's 11 fewer burgers prepped every Friday. Over a year, that's 572 fewer burger patties sitting in the walk-in waiting to be used — or thrown away.
Apply this to every high-volume item on your menu. Soups, sauces, proteins, sides — anything that's prepped in advance and has a shelf life of less than three days. The prep-to-sales forecast won't eliminate waste entirely, but it will cut the over-prep category dramatically.
For items with longer shelf life (dry goods, frozen proteins, canned goods), the forecast helps with ordering rather than daily prep. You order what the data says you'll sell over the next delivery cycle, plus a small buffer — not what you ordered last month because "we always get 10 cases."
Step 4: Track Perishable Shelf Life — Flag Items Before They Spoil
Spoilage is the second-biggest waste category for most restaurants, and it's the one that hurts the most — you paid for those ingredients and got zero revenue from them.
The fix is shelf-life tracking. Tag high-cost perishable items — proteins, dairy, produce — with their expiration dates when they come in the door. This doesn't need to be fancy. A simple labeling system with dates works. What matters is visibility — knowing which items are approaching their shelf life before they cross it.
Here's where AI adds real value. A shelf-life tracking system can flag items that are three days from expiration and alert the kitchen manager. "You have 8 pounds of salmon expiring Thursday. Current sales data suggests you'll sell 5 pounds before then. Consider a special or a menu adjustment."
That alert turns potential waste into revenue. Instead of throwing away 3 pounds of salmon on Thursday, you run a salmon special on Wednesday and sell it at full price. The cost of the salmon was already sunk — the alert turned a $45 loss into $90 in revenue.
Manual shelf-life tracking works too — it just requires discipline. Assign someone to check dates every morning. Build it into the opening checklist. The AI approach automates the alerting, but the discipline of checking is what makes any system work.
Step 5: Run a Compost Analytics Loop — Weigh Your Waste Weekly
This step sounds granular, and it is. But the data is invaluable.
Put a scale next to your waste bin. Every day, weigh the waste by category — spoilage, over-prep, plate waste, kitchen errors. Log it in a spreadsheet. At the end of the week, total it up.
After four weeks, you'll have a clear trend line. Maybe you're throwing away $180 a week in over-prep but only $40 in spoilage. That tells you to focus on prep forecasting, not ordering. Maybe spoilage is $200 a week and over-prep is $30. That tells you your ordering is off, not your prep.
The numbers remove the guesswork. Instead of "we should waste less food," you have "we're wasting $180 a week in over-prep, and here's exactly which items are contributing to it." That specificity is what drives action.
Some operators resist this step because it feels like extra work. It takes 10 minutes a day. The data it generates saves hundreds of dollars a week. That's one of the highest-ROI 10-minute investments in your restaurant.
Step 6: Set Par Levels Based on Data — Replace Gut-Feel Ordering
Once you have 4 to 8 weeks of sales data, waste data, and shelf-life tracking, you can set data-driven par levels. Par levels are the minimum quantity of each ingredient you need on hand to cover predicted sales plus a small safety buffer.
Traditional par levels are set once and rarely updated. The kitchen manager sets them based on experience, and they stay the same for months — even as the menu changes, seasons shift, and sales patterns evolve. Data-driven par levels update based on the rolling average of actual sales, adjusted for seasonality and trends.
Here's how to calculate them. For each high-cost ingredient, take your average weekly usage (from sales data) divided by your delivery frequency. Add a 10 to 15% buffer. That's your par level. If you get deliveries twice a week and use 40 pounds of chicken per week, your par level is 20 pounds plus 15% — about 23 pounds per delivery.
The par levels should adjust monthly based on the rolling average. If summer brings a 20% increase in salad sales, your lettuce par level goes up in May and back down in September. This is where the AI layer earns its keep — automatically adjusting par levels based on seasonal patterns and recent trends.
The combination of shelf-life tracking, par-level ordering, and prep-to-sales forecasting addresses the three biggest sources of waste: spoilage (ordering too much), over-prep (preparing too much), and expiration (holding too long). None of these require sophisticated AI. They require connected data and consistent execution.
What Happens After You Deploy Predictive Waste Reduction?
Restaurants that implement even the basic version of this system — waste audit, prep forecasting, shelf-life tracking — report waste reductions of 20 to 40% within the first 90 days. For a mid-size restaurant doing $15K a week in food sales, that's $5,000 to $15,000 a year back in your pocket.
The Hickory Tavern case study showed a 25% reduction in food waste after implementing a systematic tracking and forecasting approach. Their food cost dropped 3 points in the first quarter. That's not magic — it's data doing what data does when you actually use it.
The real benefit isn't just the money. It's the confidence. When your kitchen manager walks in on a busy Friday and knows exactly what to prep and how much, they stop guessing. Ticket times improve because the prep is done right. Staff morale improves because they're not scrambling to 86 items or throwing away food they spent an hour preparing.
Want to See Where Your Restaurant's Biggest AI Opportunities Are?
If you're ready to stop guessing and start using your data, take our free AI Readiness Quiz. It takes 2 minutes and shows you exactly where your restaurant has the biggest opportunities for waste reduction, cost control, and operational efficiency.
We built this quiz after seeing the same pattern in restaurant after restaurant: great food, great staff, terrible data visibility. The quiz maps your current setup and shows you where connected data — not more tools — can make the biggest difference.
Next step
Find your fastest AI revenue and time wins.
If this article sparked ideas, don't leave them as ideas. Get a Claw Prime AI SWOT assessment and we'll map the highest-leverage opportunities for your business.
Keep reading
Related posts
More practical guidance for owners who want less busywork and better follow-up.
How to Automate Staff Scheduling with AI
Your manager spends 4-6 hours a week building schedules that still end up wrong. Here's how AI builds better schedules in 10 minutes using your existing tools and POS data.
How to Migrate from Aloha POS to AI-Enhanced Operations Without Losing Data
Your Aloha POS has 3 years of sales data locked inside proprietary formats. This step-by-step guide shows you how to extract, normalize, and migrate every record without losing a single transaction.

How to Automate Temperature Log Compliance with AI Monitoring
Staff pencil-whipping temp logs? IoT sensors plus AI monitoring automate compliance logging, catch compressor drift before failure, and generate health department reports automatically.